PiStorms Data Logging
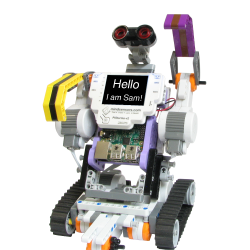
The PiStorms is a great platform for robotic, but data collection and visualization is an important facet of this. mindsensors.com is excited to release a set of data logging example programs to make it easy for you to graph your data. Let's look at some examples.
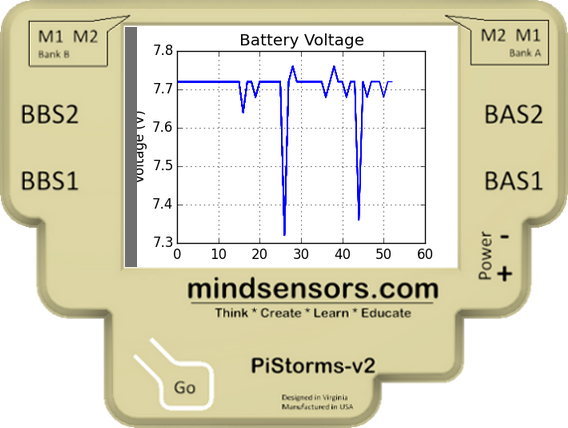
This first program uses no external sensors, so you can run it right away. It uses the PiStorm's battery voltage as the data source and introduces plotting data and putting it on the screen.

Even better, it refreshes in real time! This is an exciting feature, and doesn't make the code more complex. Also I apologize for cutting off the screenshots (whoops!).

Another example requiring no external hardware, this program demonstrates displaying only the newest 'n' values.
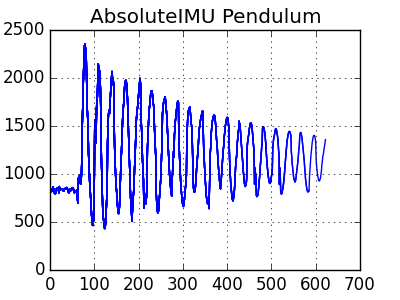
The AbsoluteIMU provides a wealth of physical data that's fun to play with. For example, a pendulum! We have a blog post detailing this project here.
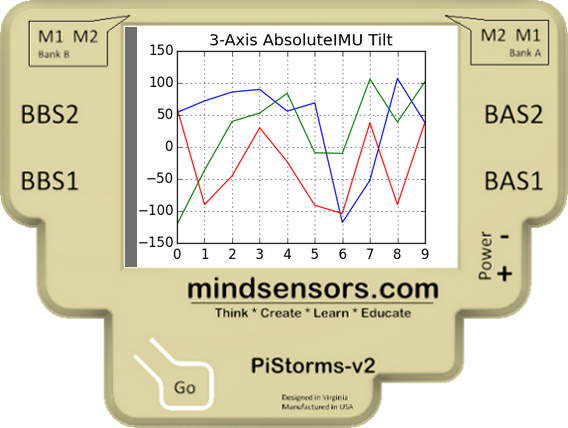
You can even plot multiple series of data! Here we are using the x, y, and z axes of tilt from the AbsoluteIMU.
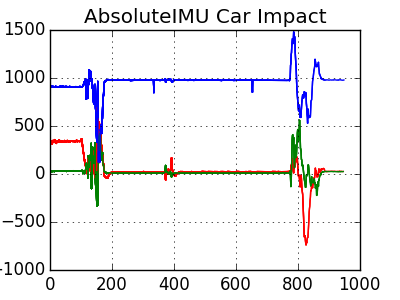
We put this to the test in a collision experiment. Check it out here!
You can find the examples in the 30-DataVisualization folder, along with plenty of comments explaining how they work. They will be included in future PiStorms SD cards, but you can find them right now on GitHub. Please adopt these examples for your own use, have fun!

